Insights and analytics
Insights and analytics provides usage analytics for Docker Verified Publisher (DVP) and Docker-Sponsored Open Source (DSOS) images on Docker Hub. This includes self-serve access to image and extension usage metrics for a desired time span. You can see the number of image pulls by tag or by digest, geolocation, cloud provider, client, and more.
メモThe Legacy DVP program applies to existing customers who have not yet renewed to DVP Core. The DVP Legacy program is deprecated and will be retired. Contact your Docker sales representative or Docker for more information.
All members of an organization have access to the analytics data. Members can access analytics data in the Docker Hub web interface.
Available reports
The following reports may be available for download as CSV files:
The reports available for download may vary based on your organization's subscription. Contact your Docker sales representative or Docker for more information.
Configure DVP analytics settings
Organization owners and editors can configure DVP analytics settings through the Admin Console to control tracked companies and benchmark report allocations for your verified publisher namespaces.
- Sign in to Docker Home and select your organization.
- Select Admin Console > Verified Publisher.
- Configure the settings:
- Tracked companies: Set the number of companies to track for reporting purposes. This setting determines how many company domains appear in your Tracked companies report. You can only set this number up to the maximum included in your DVP subscription.
- Benchmark report allocations: If your organization has benchmark reports enabled, enter the number of companies to include in the benchmark report for each namespace listed.
- Select Save to apply your changes.
Summary report
The summary report provides high-level usage metrics aggregated across all your Docker Hub content, organized by namespace and repository. This report gives you a comprehensive overview of your image portfolio performance, helping you understand which repositories, tags, and specific image versions are most popular with your users.
You can use this report to answer questions like:
- Which of my repositories are getting the most usage?
- How do different image tags compare in terms of adoption?
- What's the ratio of actual downloads versus version checks across my portfolio?
- Which specific image digests are being pulled most frequently?
- How has overall usage changed over time for my entire image collection?
To access the report:
- Sign in to Docker Hub.
- Select My Hub in the top navigation.
- Select your organization in the left navigation.
- Select Analytics > Overview in the left navigation.
- Download the report by doing one of the following:
- Select Download Weekly Summary.
- Select the Download Monthly Summary.
- Expand the Summary reports for the year drop-down and then select Download report for the desired week or month.
The summary report is a CSV file that contains the following data points:
| Field | Description |
|---|---|
DATE_GRANULARITY | Weekly or monthly granularity of the data. Indicates whether the data is aggregated by week or month. |
DATE_REFERENCE | The start date of the week or month in YYYY-MM-DD format (e.g., 2025-09-29 for the week starting September 29, 2025). |
PUBLISHER_NAME | The name of the Docker organization that owns the repository (e.g., demonstrationorg). |
LEVEL | The aggregation level of the data - either repository (summary for entire repository), tag (summary for specific tag), or digest (summary for specific digest). |
REFERENCE | The specific reference being summarized - the repository name, tag name, or digest hash depending on the level. |
DATA_DOWNLOADS | The number of actual image downloads. |
VERSION_CHECKS | The number of version checks performed (HEAD requests to check for updates without downloading the full image). |
EVENT_COUNT | The total number of events, calculated as the sum of data downloads and version checks. |
Trends report
The trends report helps you understand how adoption of your container images evolves over time. It provides visibility into pull activity across repositories and tags, enabling you to identify adoption patterns, version migration trends, and usage environments (e.g., local development, CI/CD, production).
You can use this report to answer questions like:
- Which versions are gaining or losing traction?
- Is a new release being adopted?
- How does usage vary across cloud providers?
To access the report:
- Sign in to Docker Hub.
- Select My Hub in the top navigation.
- Select your organization in the left navigation.
- Select Analytics > Trends in the left navigation.
- Select DATA BY WEEK or DATA BY MONTH to choose the data granularity.
- Select Download report for the desired week or month.
The trends report is a CSV file that contains the following data points:
| Field | Description |
|---|---|
DATE_GRANULARITY | Weekly or monthly granularity of the data. |
DATE_REFERENCE | The start date of the week or month. |
PUBLISHER_NAME | The name of the organization that owns the repository. |
IMAGE_REPOSITORY | The full name of the image repository (e.g., demonstrationorg/scout-demo). |
NAMESPACE | The Docker organization or namespace that owns the repository. |
IP_COUNTRY | The country code (ISO 3166-1 alpha-2) where the pull request originated from (e.g., US, CA). |
CLOUD_SERVICE_PROVIDER | The cloud service provider used for the pull request (e.g., gcp, aws, azure) or no csp for non-cloud providers. |
USER_AGENT | The client application or tool used to pull the image (e.g., docker, docker-scout, node-fetch, regclient). |
TAG | The specific image tag that was pulled, or \\N if no specific tag was used. |
DATA_DOWNLOADS | The number of data downloads for the specified criteria. |
VERSION_CHECKS | The number of version checks (HEAD requests) performed without downloading the full image. |
PULLS | The total number of pull requests (data downloads + version checks). |
UNIQUE_AUTHENTICATED_USERS | The number of unique authenticated users who performed pulls. |
UNIQUE_UNAUTHENTICATED_USERS | The number of unique unauthenticated users who performed pulls. |
Technographic report
The technographic report provides insights into how your Docker Verified Publisher (DVP) images are used alongside other container images in real-world technology stacks. This report helps you understand the technical ecosystem where your images operate and identify co-usage patterns with other images.
You can use this report to answer questions like:
- Which other images are commonly used together with your images?
- What percentage of your user base also uses specific complementary technologies?
- How many companies in your ecosystem use both your image and other popular images?
- What technology stacks are most popular among your users?
To access the report:
- Sign in to Docker Hub.
- Select My Hub in the top navigation.
- Select your organization in the left navigation.
- Select Analytics > Technographic in the left navigation.
- Select DATA BY WEEK or DATA BY MONTH to choose the data granularity.
- Select Download report for the desired week or month.
The technographic report is a CSV file that contains the following data points:
| Field | Description |
|---|---|
DATE_GRANULARITY | Weekly or monthly granularity of the data. |
DATE_REFERENCE | The start date of the week or month in YYYY-MM-DD format. |
PUBLISHER_ID | The unique identifier for the publisher organization. |
PUBLISHER_NAME | The name of the organization that owns the DVP repository. |
DVPP_IMAGE | Your Docker Verified Publisher image repository name. |
PAIRED_IMAGE | The other image repository that is commonly used together with your DVP image. |
USERS | The number of unique users who pulled both your DVP image and the paired image within the time period. |
TOTAL_PULLERS | The total number of unique users who pulled your DVP image during the time period. |
PCT_USERS | The percentage of your image's users who also use the paired image (users/total_pullers). |
DOMAINS | The number of unique company domains that pulled both your DVP image and the paired image. |
TOTAL_DOMAINS | The total number of unique company domains that pulled your DVP image. |
PCT_DOMAINS | The percentage of company domains using your image that also use the paired image (domains/total_domains). |
メモTo protect user privacy and ensure statistical significance, the technographic report only includes image pairings that have at least 10 unique users. Personal, disposable, and university email domains are excluded from the company domain analysis.
Technographic companies report
The technographic companies report provides a detailed view of which specific companies (identified by their domains) are using your Docker Verified Publisher (DVP) images together with other container images. This report gives you visibility into the actual organizations adopting your technology stack combinations, enabling targeted business development and partnership opportunities.
You can use this report to answer questions like:
- Which companies are using my image alongside specific complementary technologies?
- What technology stacks are adopted by enterprise customers in my target market?
- Which organizations might be good candidates for partnership discussions?
- How can I identify potential customers who are already using related technologies?
To access the report:
- Sign in to Docker Hub.
- Select My Hub in the top navigation.
- Select your organization in the left navigation.
- Select Analytics > Technographic in the left navigation.
- Select DATA BY WEEK or DATA BY MONTH to choose the data granularity.
- Select Download report for the desired week or month.
The technographic companies report is a CSV file that contains the following data points:
| Field | Description |
|---|---|
DATE_GRANULARITY | Weekly or monthly granularity of the data. |
DATE_REFERENCE | The start date of the week or month in YYYY-MM-DD format. |
PUBLISHER_NAME | The name of the organization that owns the DVP repository. |
DOMAIN | The company domain that pulled both your DVP image and the paired image (e.g., example.com). |
DVPP_IMAGE | Your Docker Verified Publisher image repository name. |
PAIRED_IMAGE | The other image repository that was used together with your DVP image by this company. |
Each row represents a unique combination of a company domain, your DVP image, and another image that were used together during the specified time period.
メモTo protect privacy and ensure data quality, this report excludes personal email domains, disposable email services, and university domains. Only business and organizational domains are included in the analysis.
Tracked companies report
The tracked companies report provides detailed insights into how specific companies are using your Docker Verified Publisher (DVP) images. This report helps you understand usage patterns, deployment environments, and adoption trends across your customer base and potential prospects.
You can use this report to answer questions like:
- How are specific companies using my images across different environments?
- What deployment patterns do I see across local development, CI/CD, and production?
- Which companies are heavy users of my images?
- How does usage vary by geography and cloud providers for tracked companies?
To access the report:
- Sign in to Docker Hub.
- Select My Hub in the top navigation.
- Select your organization in the left navigation.
- Select Analytics > Tracked Companies in the left navigation.
- Select DATA BY WEEK or DATA BY MONTH to choose the data granularity.
- Select Download report for the desired week or month.
The tracked companies report is a CSV file that contains the following data points:
| Field | Description |
|---|---|
DATE_GRANULARITY | Weekly or monthly granularity of the data. |
DATE_REFERENCE | The start date of the week or month in YYYY-MM-DD format. |
PUBLISHER_NAME | The name of the organization that owns the DVP repository. |
DOMAIN | The company domain (e.g., docker.com) associated with the image pulls. |
IP_COUNTRY | The country code (ISO 3166-1 alpha-2) where the pull request originated from. |
CLOUD_SERVICE_PROVIDER | The cloud service provider used for the pull request or no csp for non-cloud providers. |
USER_AGENT | The client application or tool used to pull the image. |
INFERRED_USE_CASE | The inferred deployment environment based on user agent and cloud provider analysis. Values include: • Local Dev: Local development environment (e.g., Docker Desktop, direct docker commands)• CI/CD: Continuous integration/deployment pipelines (e.g., containerd, build tools, registry mirroring)• Prod: Production environments (e.g., Kubernetes, container orchestration platforms)• Unknown: Unable to determine the use case from available data |
IMAGE_REPOSITORY | The specific DVP image repository that was pulled. |
DATA_DOWNLOADS | The number of actual image layer downloads for this combination. |
VERSION_CHECKS | The number of version checks (HEAD requests) performed without downloading the full image. |
PULLS | The total number of pull requests (data downloads + version checks). |
UNIQUE_AUTHENTICATED_USERS | The number of unique authenticated users from this domain who performed pulls. |
メモUse case inference is determined by analyzing user agent patterns and cloud service provider usage. Local development tools used on cloud infrastructure are reclassified as CI/CD, and CI/CD tools used on cloud infrastructure are reclassified as production to better reflect actual deployment patterns.
重要The Legacy DVP program applies to existing customers who have not yet renewed to DVP Core. The DVP Legacy program is deprecated and will be retired. Contact your Docker sales representative or Docker for more information.
View the image's analytics data
You can find analytics data for your repositories on the Insights and
analytics dashboard at the following URL:
https://hub.docker.com/orgs/{namespace}/insights/images. The dashboard
contains a visualization of the usage data and a table where you can download
the data as CSV files.
To view data in the chart:
- Select the data granularity: weekly or monthly
- Select the time interval: 3, 6, or 12 months
- Select one or more repositories in the list
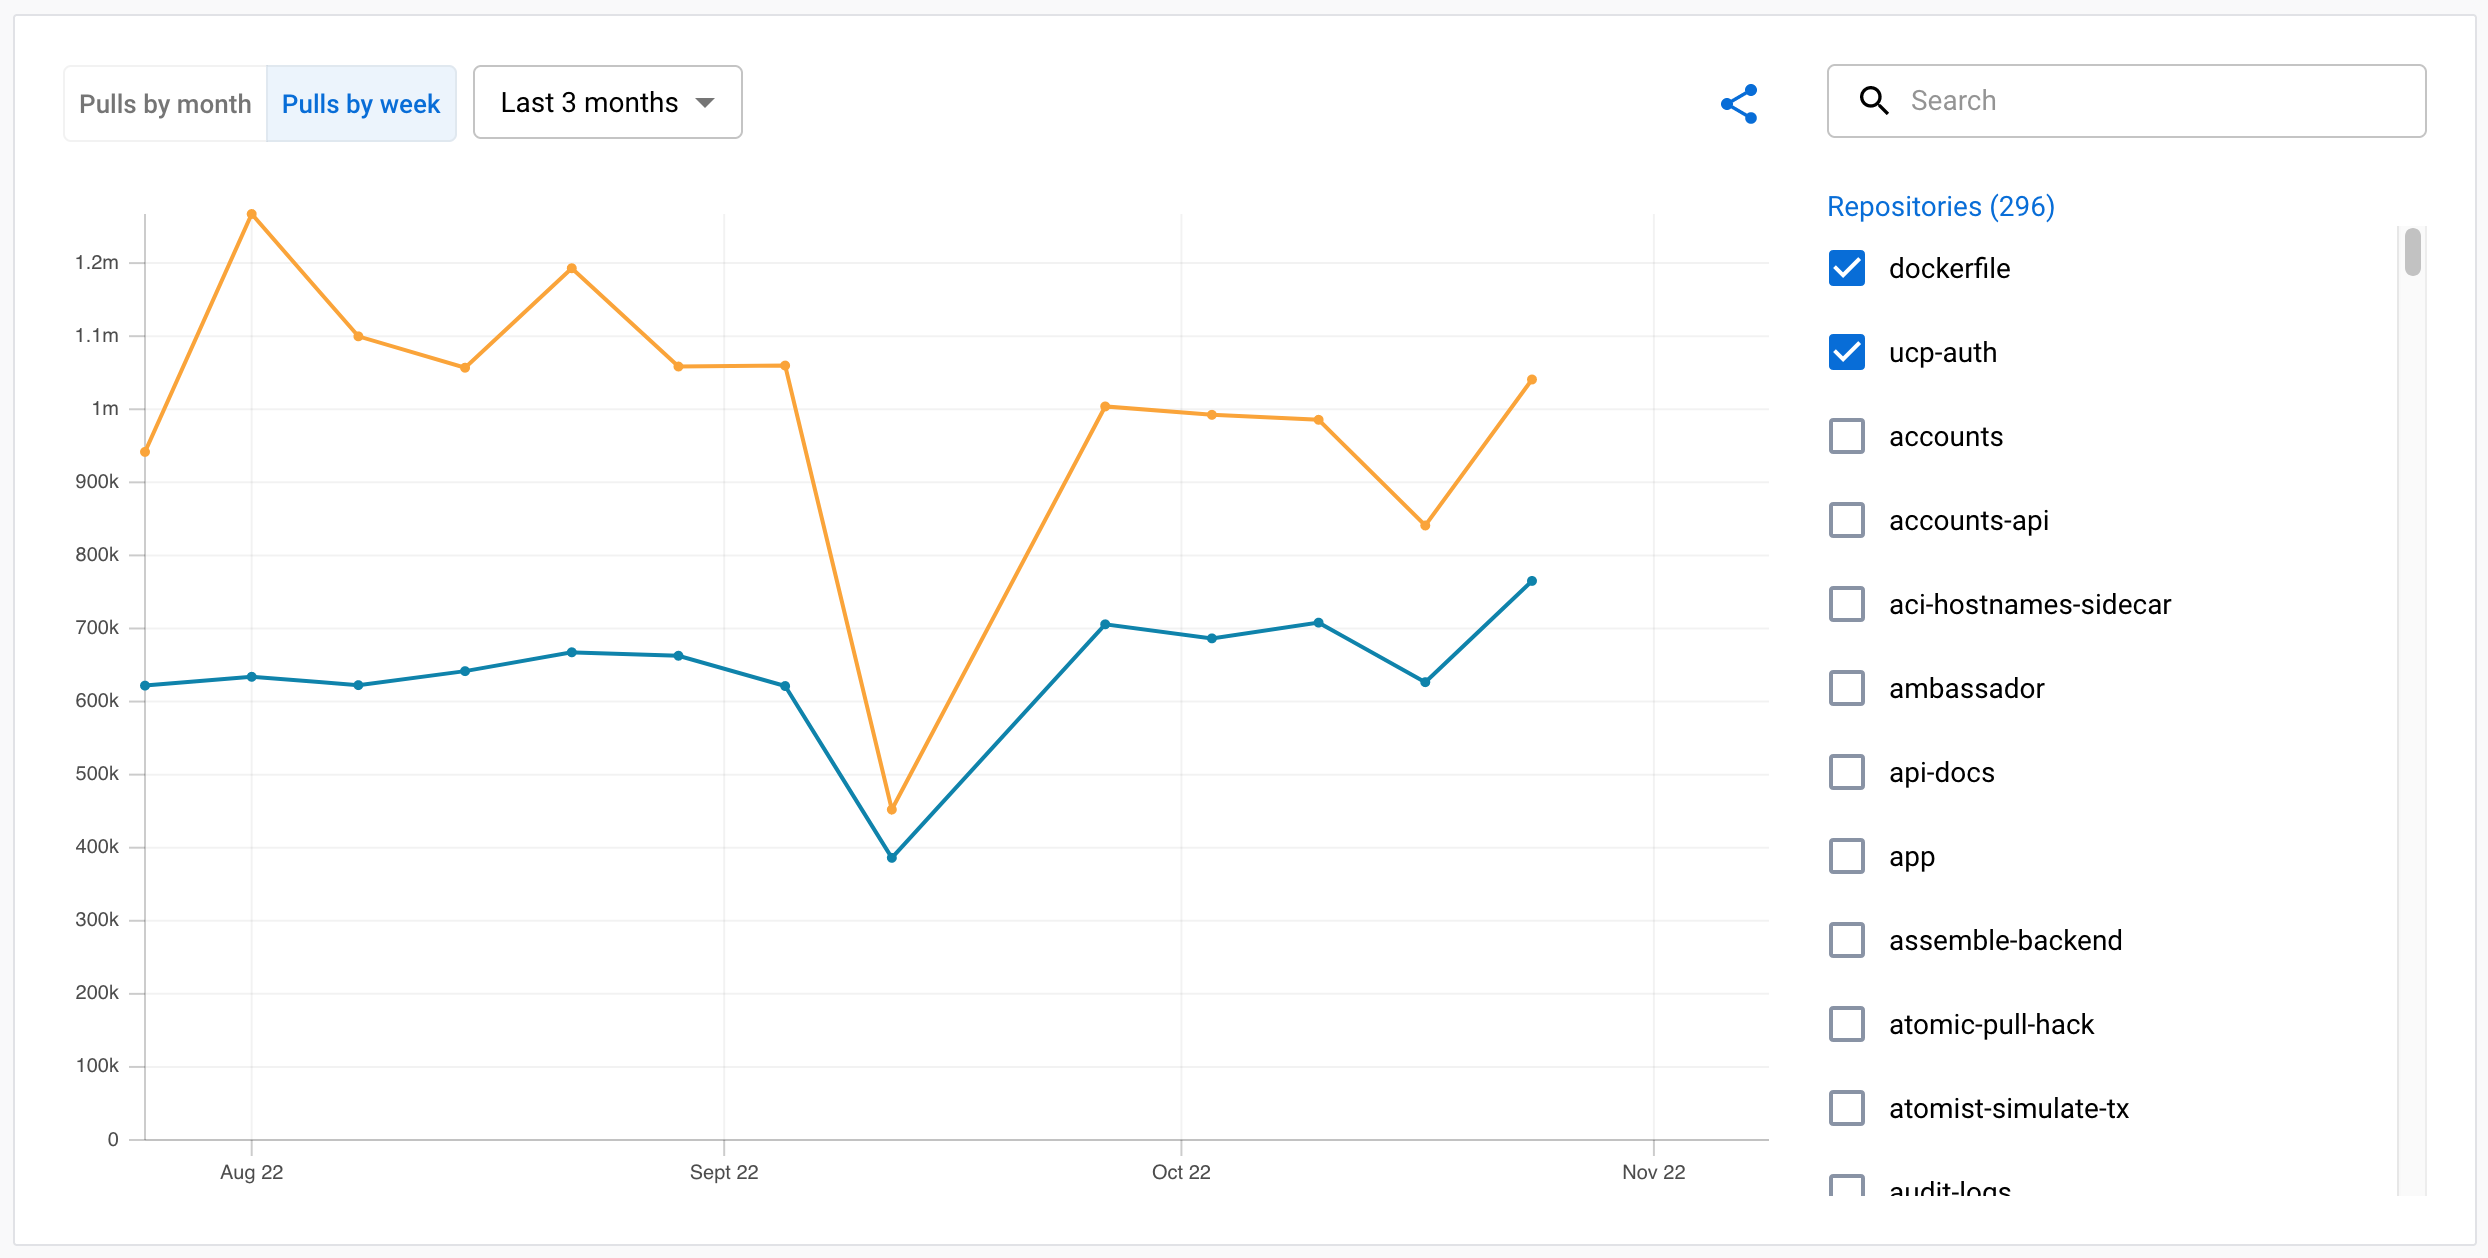
情報Hovering your cursor over the chart displays a tooltip, showing precise data for points in time.
Share analytics data
You can share the visualization with others using the Share icon at the top of the chart. This is a convenient way to share statistics with others in your organization.
Selecting the icon generates a link that's copied to your clipboard. The link preserves the display selections you made. When someone follows the link, the Insights and analytics page opens and displays the chart with the same configuration as you had set up when creating the link.
Extension analytics data
If you have published Docker Extensions in the Extension marketplace, you can
also get analytics about your extension usage, available as CSV files. You can
download extension CSV reports from the Insights and analytics dashboard at
the following URL:
https://hub.docker.com/orgs/{namespace}/insights/extensions. If your Docker
namespace contains extensions known in the marketplace, you will see an
Extensions tab listing CSV files for your extension(s).
Exporting analytics data
You can export the analytics data either from the web dashboard, or using the DVP Data API. All members of an organization have access to the analytics data.
The data is available as a downloadable CSV file, in a weekly (Monday through Sunday) or monthly format. Monthly data is available from the first day of the following calendar month. You can import this data into your own systems, or you can analyze it manually as a spreadsheet.
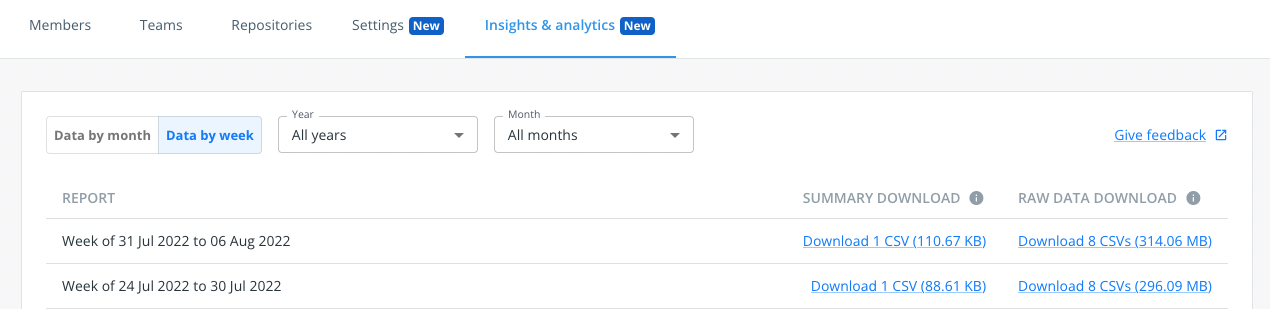
Export data
Export usage data for your organization's images using the Docker Hub website by following these steps:
Sign in to Docker Hub and select My Hub.
Choose your organization and select Analytics.
Set the time span for which you want to export analytics data.
The downloadable CSV files for summary and raw data appear on the right-hand side.
Export data using the API
The HTTP API endpoints are available at:
https://hub.docker.com/api/publisher/analytics/v1. Learn how to export data
using the API in the DVP Data API documentation.
Data points
Export data in either raw or summary format. Each format contains different data points and with different structure.
The following sections describe the available data points for each format. The Date added column shows when the field was first introduced.
Image pulls raw data
The raw data format contains the following data points. Each row in the CSV file represents an image pull.
| Data point | Description | Date added |
|---|---|---|
| Action | Request type, see Action classification rules. One of pull_by_tag, pull_by_digest, version_check. | January 1, 2022 |
| Action day | The date part of the timestamp: YYYY-MM-DD. | January 1, 2022 |
| Country | Request origin country. | January 1, 2022 |
| Digest | Image digest. | January 1, 2022 |
| HTTP method | HTTP method used in the request, see registry API documentation for details. | January 1, 2022 |
| Host | The cloud service provider used in an event. | January 1, 2022 |
| Namespace | Docker organization (image namespace). | January 1, 2022 |
| Reference | Image digest or tag used in the request. | January 1, 2022 |
| Repository | Docker repository (image name). | January 1, 2022 |
| Tag (included when available) | Tag name that's only available if the request referred to a tag. | January 1, 2022 |
| Timestamp | Date and time of the request: YYYY-MM-DD 00:00:00. | January 1, 2022 |
| Type | The industry from which the event originates. One of business, isp, hosting, education, null. | January 1, 2022 |
| User agent tool | The application a user used to pull an image (for example, docker or containerd). | January 1, 2022 |
| User agent version | The version of the application used to pull an image. | January 1, 2022 |
| Domain | Request origin domain, see Privacy. | October 11, 2022 |
| Owner | The name of the organization that owns the repository. | December 19, 2022 |
Image pulls summary data
There are two levels of summary data available:
- Repository-level, a summary of every namespace and repository
- Tag- or digest-level, a summary of every namespace, repository, and reference (tag or digest)
The summary data formats contain the following data points for the selected time span:
| Data point | Description | Date added |
|---|---|---|
| Unique IP address | Number of unique IP addresses, see Privacy. | January 1, 2022 |
| Pull by tag | GET request, by digest or by tag. | January 1, 2022 |
| Pull by digest | GET or HEAD request by digest, or HEAD by digest. | January 1, 2022 |
| Version check | HEAD by tag, not followed by a GET | January 1, 2022 |
| Owner | The name of the organization that owns the repository. | December 19, 2022 |
Image pulls action classification rules
An action represents the multiple request events associated with a
docker pull. Pulls are grouped by category to make the data more meaningful
for understanding user behavior and intent. The categories are:
- Version check
- Pull by tag
- Pull by digest
Automated systems frequently check for new versions of your images. Being able to distinguish between "version checks" in CI versus actual image pulls by a user grants you more insight into your users' behavior.
The following table describes the rules applied for determining intent behind pulls. To provide feedback or ask questions about these rules, fill out the Google Form.
| Starting event | Reference | Followed by | Resulting action | Use case(s) | Notes |
|---|---|---|---|---|---|
| HEAD | tag | N/A | Version check | User already has all layers existing on local machine | This is similar to the use case of a pull by tag when the user already has all the image layers existing locally, however, it differentiates the user intent and classifies accordingly. |
| GET | tag | N/A | Pull by tag | User already has all layers existing on local machine and/or the image is single-arch | |
| GET | tag | Get by different digest | Pull by tag | Image is multi-arch | Second GET by digest must be different from the first. |
| HEAD | tag | GET by same digest | Pull by tag | Image is multi-arch but some or all image layers already exist on the local machine | The HEAD by tag sends the most current digest, the following GET must be by that same digest. There may occur an additional GET, if the image is multi-arch (see the next row in this table). If the user doesn't want the most recent digest, then the user performs HEAD by digest. |
| HEAD | tag | GET by the same digest, then a second GET by a different digest | Pull by tag | Image is multi-arch | The HEAD by tag sends the most recent digest, the following GET must be by that same digest. Since the image is multi-arch, there is a second GET by a different digest. If the user doesn't want the most recent digest, then the user performs HEAD by digest. |
| HEAD | tag | GET by same digest, then a second GET by different digest | Pull by tag | Image is multi-arch | The HEAD by tag sends the most current digest, the following GET must be by that same digest. Since the image is multi-arch, there is a second GET by a different digest. If the user doesn't want the most recent digest, then the user performs HEAD by digest. |
| GET | digest | N/A | Pull by digest | User already has all layers existing on local machine and/or the image is single-arch | |
| HEAD | digest | N/A | Pull by digest | User already has all layers existing on their local machine | |
| GET | digest | GET by different digest | Pull by digest | Image is multi-arch | The second GET by digest must be different from the first. |
| HEAD | digest | GET by same digest | Pull by digest | Image is single-arch and/or image is multi-arch but some part of the image already exists on the local machine | |
| HEAD | digest | GET by same digest, then a second GET by different digest | Pull by Digest | Image is multi-arch |
Extension Summary data
There are two levels of extension summary data available:
- Core summary, with basic extension usage information: number of extension installs, uninstalls, and total install all times
The core-summary-data file contains the following data points for the selected time span:
| Data point | Description | Date added |
|---|---|---|
| Installs | Number of installs for the extension | Feb 1, 2024 |
| TotalInstalls | Number of installs for the extension all times | Feb 1, 2024 |
| Uninstalls | Number of uninstalls for the extension | Feb 1, 2024 |
| TotalUninstalls | Number of uninstalls for the extension all times | Feb 1, 2024 |
| Updates | Number of updates for the extension | Feb 1, 2024 |
- Premium summary, with advanced extension usage information: installs, uninstalls by unique users, extension opening by unique users.
The core-summary-data file contains the following data points for the selected time span:
| Data point | Description | Date added |
|---|---|---|
| Installs | Number of installs for the extension | Feb 1, 2024 |
| UniqueInstalls | Number of unique users installing the extension | Feb 1, 2024 |
| Uninstalls | Number of uninstalls for the extension | Feb 1, 2024 |
| UniqueUninstalls | Number of unique users uninstalling the extension | Feb 1, 2024 |
| Usage | Number of openings of the extension tab | Feb 1, 2024 |
| UniqueUsers | Number of unique users openings the extension tab | Feb 1, 2024 |
Changes in data over time
The insights and analytics service is continuously improved to increase the value it brings to publishers. Some changes might include adding new data points, or improving existing data to make it more useful.
Changes in the dataset, such as added or removed fields, generally only apply from the date of when the field was first introduced, and going forward.
Refer to the tables in the Data points section to see from which date a given data point is available.
Privacy
This section contains information about privacy-protecting measures that ensures consumers of content on Docker Hub remain completely anonymous.
重要Docker never shares any Personally Identifiable Information (PII) as part of analytics data.
The image pulls summary dataset includes unique IP address count. This data point only includes the number of distinct unique IP addresses that request an image. Individual IP addresses are never shared.
The image pulls raw dataset includes user IP domains as a data point. This is
the domain name associated with the IP address used to pull an image. If the IP
type is business, the domain represents the company or organization associated
with that IP address (for example, docker.com). For any other IP type that's
not business, the domain represents the internet service provider or hosting
provider used to make the request. On average, only about 30% of all pulls
classify as the business IP type (this varies between publishers and images).